UPS Energy Monitor
April 27, 2026
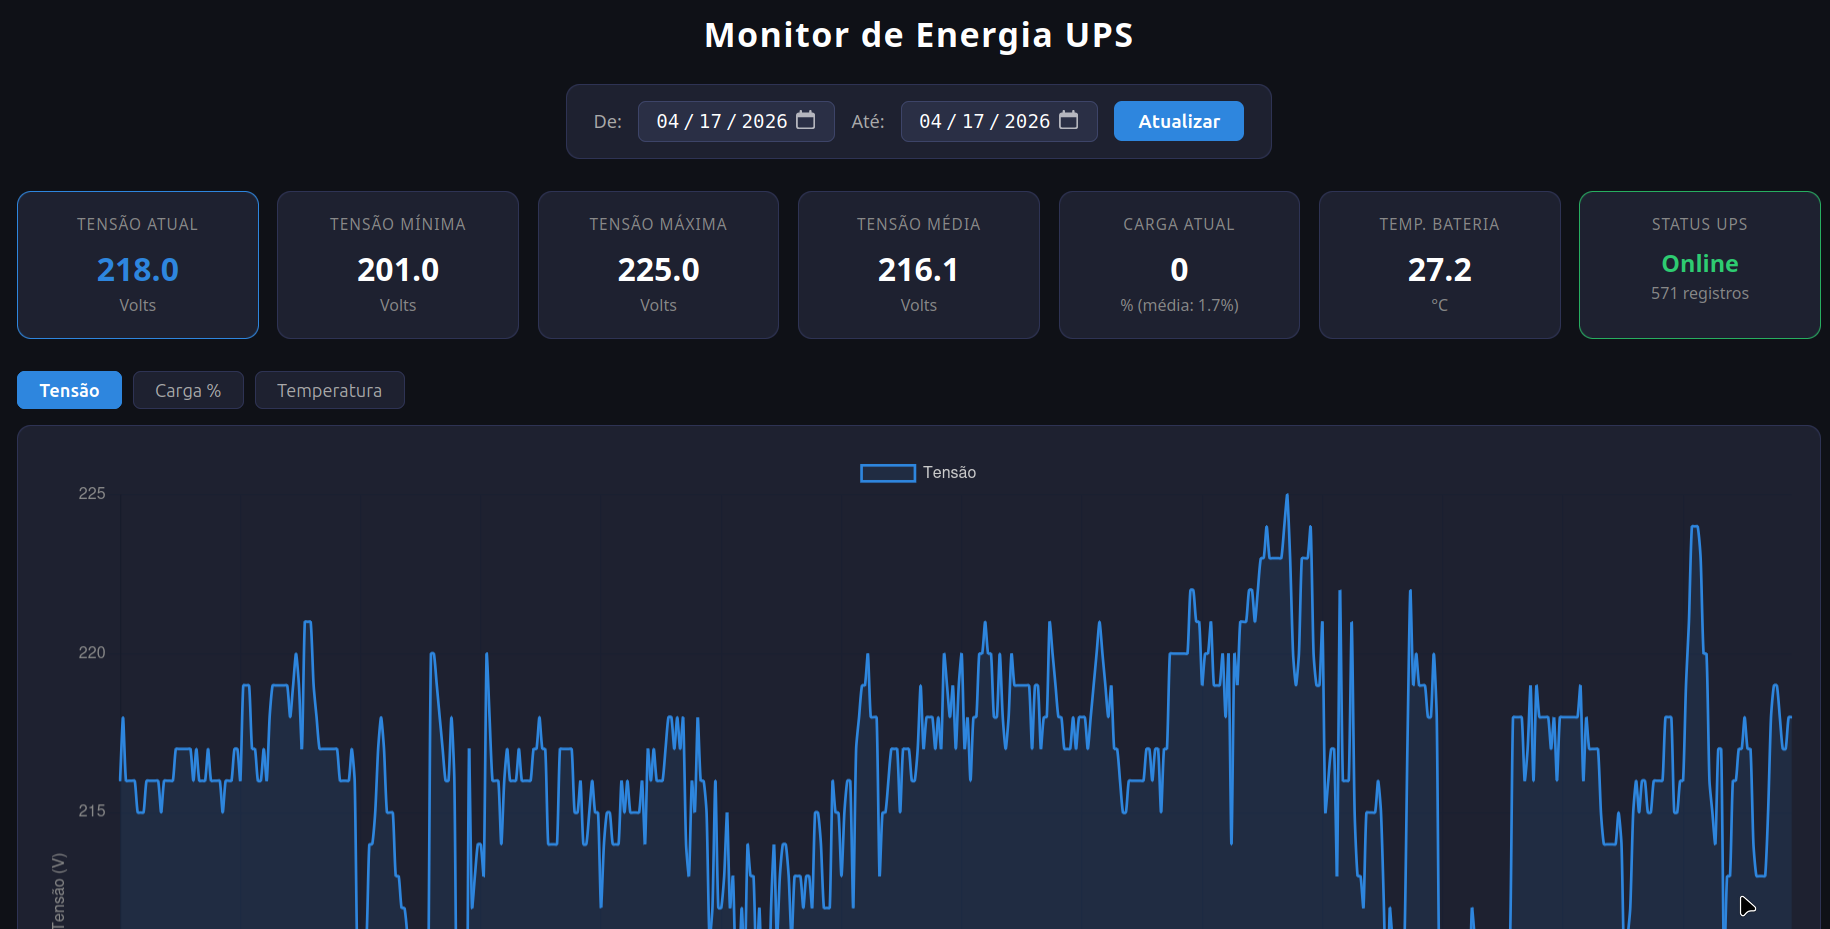
A web dashboard for real-time UPS monitoring. It reads log data produced by upslog from Network UPS Tools and turns it into cards and charts for input voltage, battery charge, current load, estimated runtime, battery voltage, and UPS status.
The frontend expects a simple data/data.txt file generated by cron. Each line is separated by semicolons and includes the date, time, and UPS metrics in a fixed order. The application parses those records and converts the runtime value from seconds into a more readable hours/minutes format.
The dashboard shows current values alongside voltage summaries, including minimum, maximum, and average readings. Historical charts can be filtered by date range, making it useful for checking power stability and UPS health on a home server or any machine that needs to stay online.
The project is organized as a small Flask/WSGI application, with HTML templates under power_ups_dashboard, local UPS logs under data/, and documentation screenshots under docs/assets.
Stack: Python, Flask, Chart.js, Network UPS Tools (upslog), Docker.
Technologies: Python, Flask, Chart.js, NUT, Docker